
HPLC and Mass Spectrometry: How Peptide Purity Is Actually Measured
Reverse-phase HPLC and mass spectrometry are the two workhorse techniques behind every credible peptide purity number. Here is what they measure, how they work together, and how to interpret the results.
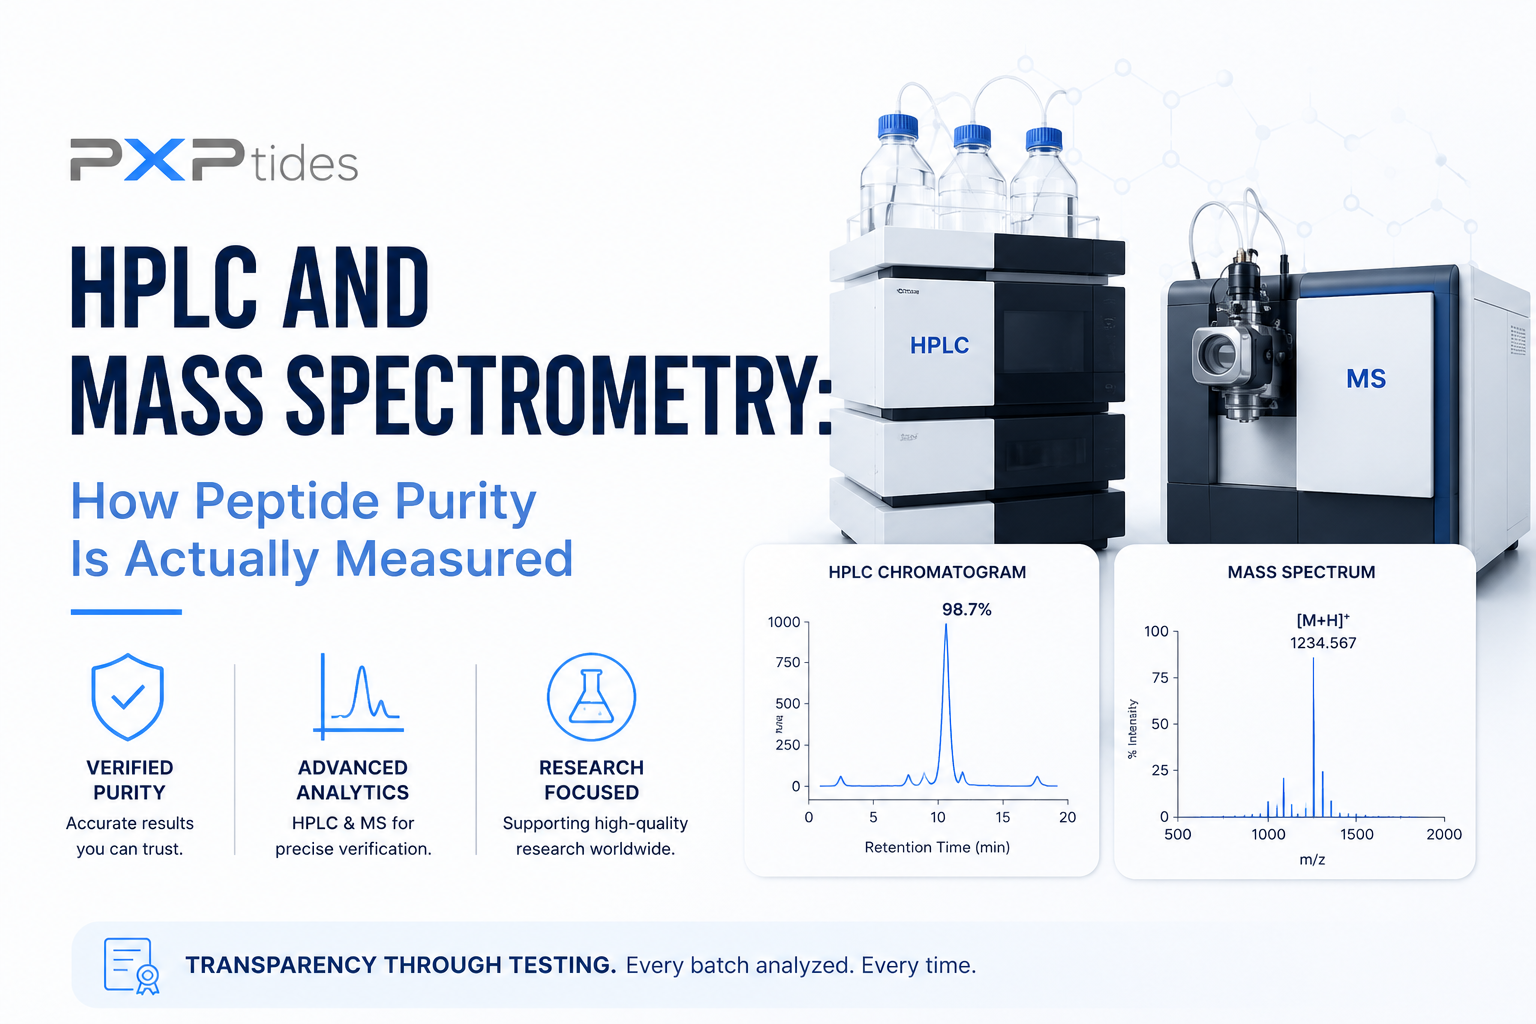
Behind every credible peptide purity number is a pair of analytical techniques: reverse-phase HPLC and mass spectrometry. They are the two workhorses of modern peptide quality control, and any supplier that sells research-grade material should be running both on every lot. This article explains, in plain English, what each technique actually measures, how they complement each other, and how to read their output with informed confidence.
Reverse-phase HPLC, demystified
High-performance liquid chromatography (HPLC) separates molecules in a mixture based on how they interact with a column. In reverse-phase HPLC (RP-HPLC), the column is packed with a non-polar (hydrophobic) stationary phase — usually C18 silica — and the mobile phase that flows through the column is a gradient of water mixed with an organic solvent, typically acetonitrile. A small amount of trifluoroacetic acid (TFA) is usually added as an ion-pairing agent because it improves peak shape for charged peptide species.
Here is the intuition: a peptide injected into the column will spend more or less time stuck to the hydrophobic stationary phase depending on how hydrophobic the peptide is. A polar peptide elutes early; a more hydrophobic peptide elutes later. As the gradient gets richer in acetonitrile, the elution conditions get more favorable for more-hydrophobic species, and different peptides come off the column at different times. A detector at the end of the column records what comes through.
What the chromatogram shows
The output of an HPLC run is a chromatogram: a plot of detector signal versus time. Each peak corresponds to something coming off the column. For a well-purified peptide, you should see:
- One large, sharp main peak — that is the target peptide.
- A flat or near-flat baseline elsewhere — meaning very few other species are present.
- Optional small peaks — usually trace impurities, related sequences, or degradation products.
Detection is typically at 214 nm. That wavelength is chosen because peptide bonds themselves absorb strongly there, which means the detector will see impurities that lack aromatic residues. Detection at 280 nm picks up only species with tryptophan, tyrosine, or phenylalanine — useful for confirmation, but not the right primary wavelength for purity work.
How purity is calculated
Purity by HPLC is reported as the area of the main peak divided by the total integrated peak area, expressed as a percentage. So a peptide reported at 99.2 percent pure by HPLC at 214 nm means that, in the integrated chromatogram, the main peak accounts for 99.2 percent of the total absorbance area.
A few caveats are worth understanding:
- The gradient matters. Two laboratories running different gradient profiles on the same lot can report slightly different purity numbers. This is normal.
- The wavelength matters. A peptide reported as 99 percent pure at 280 nm but unspecified at 214 nm is reporting a less stringent test.
- The column matters. Different stationary phases resolve impurities differently. For routine peptide QC, a C18 column with a standard gradient is the workhorse, but specialty work sometimes uses different phases.
A good COA states the method clearly so anyone reading it can reproduce the analysis if needed.
Mass spectrometry for identity
Mass spectrometry (MS) confirms what the eluted peptide actually is. The standard technique for research peptides is electrospray ionization mass spectrometry (ESI-MS), often hyphenated to HPLC as LC-MS so identity and purity can be measured in the same run. Matrix-assisted laser desorption/ionization time-of-flight (MALDI-TOF) is also used in some labs.
Both techniques do roughly the same thing: ionize the peptide, accelerate the resulting ions through an electric or magnetic field, and measure their mass-to-charge ratio. From that, the molecular weight of the peptide is calculated and compared with the expected mass for the sequence.
For a correctly identified peptide, the observed mass should match the calculated mass within instrument tolerance — typically a few parts per million on a modern instrument. A mismatch is a red flag.
Catching modifications
Mass spectrometry is also sensitive to common chemical modifications:
- Oxidation of methionine, tryptophan, or cysteine residues appears as a +16 Da mass shift.
- Deamidation of asparagine or glutamine appears as a +1 Da shift.
- Truncations appear as missing-residue mass losses.
- Aggregation or dimerization appears as multiples of the monomer mass.
In practice, MS routinely catches these. Combined with HPLC, the two techniques flag both quantity and identity problems before material reaches a researcher.
Why both are required
HPLC tells you how clean the material is. Mass spectrometry tells you whether the main peak is the molecule you think it is. Neither alone is sufficient.
- A peptide that is 99 percent pure by HPLC but has the wrong mass by MS is not the peptide you ordered, regardless of how clean the chromatogram looks.
- A peptide with the correct mass by MS but only 90 percent purity by HPLC may still be the right molecule, but with significant impurities that could affect quantitative work.
A complete peptide COA reports both numbers, ideally from the same lot, ideally with the methods stated.
Limitations to keep in mind
Both techniques are powerful, but neither is infallible:
- HPLC is not absolute. Two laboratories can report slightly different purity numbers on the same lot because methods differ. For high-stakes comparisons, the same lab should run the analysis on both samples under matched conditions.
- MS does not distinguish all isomers. Some sequence isomers have identical masses. For these, additional tools (such as tandem MS for sequence confirmation, or chiral analysis for D-/L-amino acid composition) may be needed.
- Detection is wavelength-limited. Impurities that do not absorb at the chosen wavelength can be invisible to HPLC.
For most routine research, the standard HPLC + MS workflow is more than sufficient. For experiments where exquisite characterization matters, ask whether your supplier can supply orthogonal analytical data on request.
What this means for buyers
When evaluating a research peptide supplier, four practical questions cover most of the analytical territory:
- Do your COAs include both HPLC purity and MS identity for every lot?
- What wavelength is HPLC reported at, and what method is used?
- Are chromatograms and mass spectra available on request?
- What is your net peptide content method?
Suppliers that have ready answers to these questions are usually easier to audit. Suppliers that deflect, hedge, or supply generic specification sheets in place of lot-matched analytical data are flagging a quality posture you may not want to depend on for your own published work.
Bottom line
HPLC and mass spectrometry are why research-grade peptides can be trusted as analytical inputs at all. They turn a vial of white powder into a characterized, traceable reagent. Knowing how each technique works — and what its limitations are — lets researchers read COAs with informed confidence and have meaningful conversations with their suppliers about quality. At PXPtides we publish both numbers for every lot and supply underlying data on request, because that is the only way the QC chain genuinely supports the science.